← Back to Apps
Live Web

Irshad AI CRM

A sales and analytics CRM with an AI analyst built in. Ask plain-English questions about your customers, products, inventory and suppliers and get instant answers and charts. Connects to your accounting and inventory software through a custom connector.

Irshad AI CRM is a modern sales operations workspace. It gives you an executive pulse dashboard, a customer list and a rich Customer 360, plus Product, Inventory and Supplier 360 views, and an AI Q&A analyst that answers questions about your business in plain English, with charts. This is a live demo running on realistic sample data. To run it on your own numbers we deploy a custom connector to your accounting software (for example QuickBooks) and your inventory software (for example Fishbowl).

Open the live demo
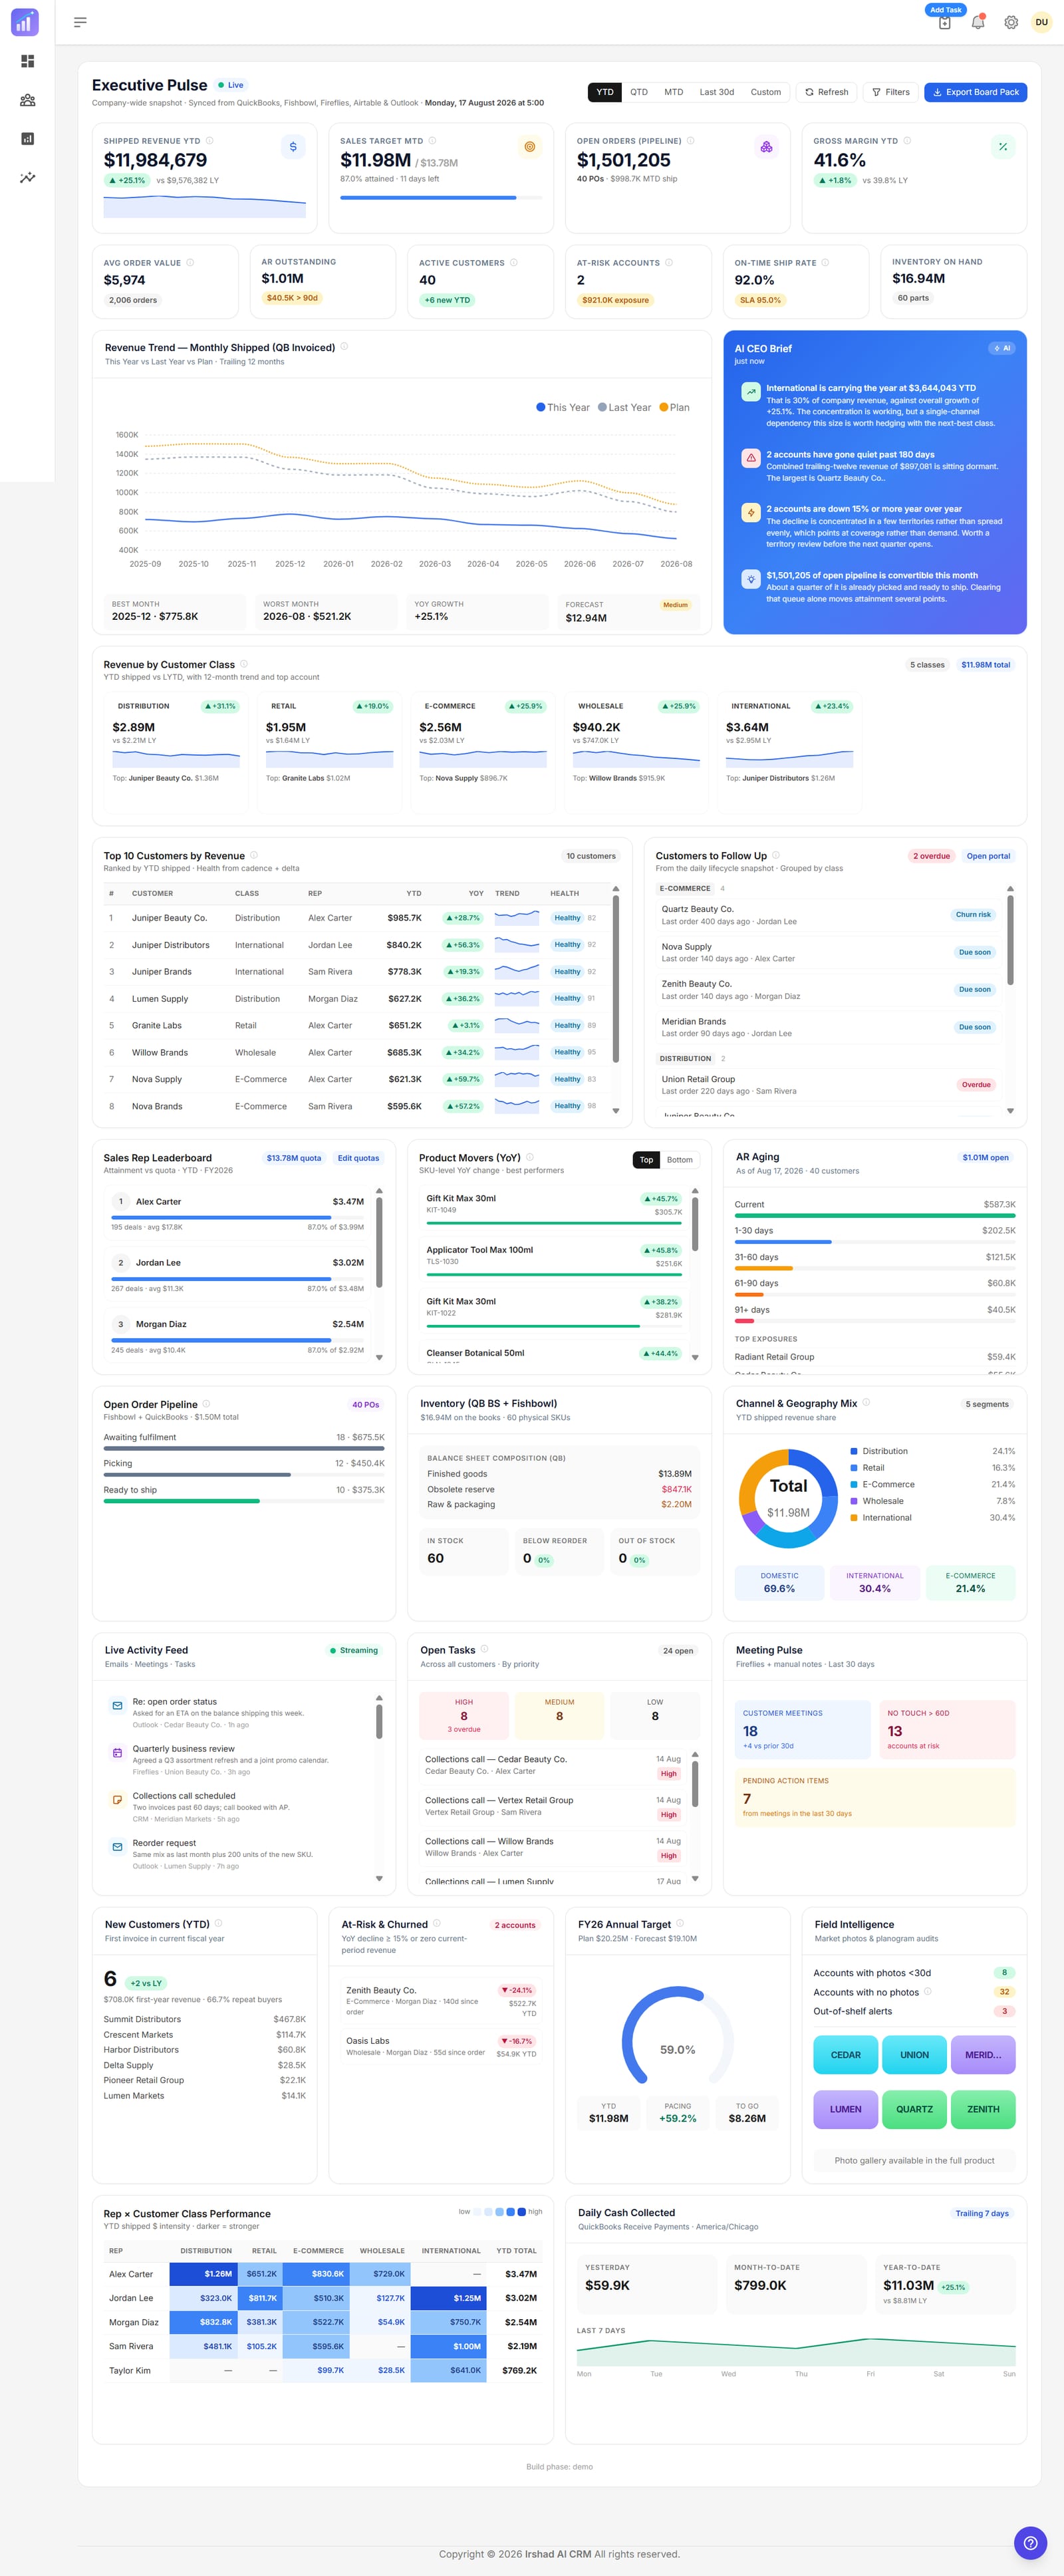
Executive Pulse dashboard with revenue versus last year, AR, inventory, cash and forecast at a glance.
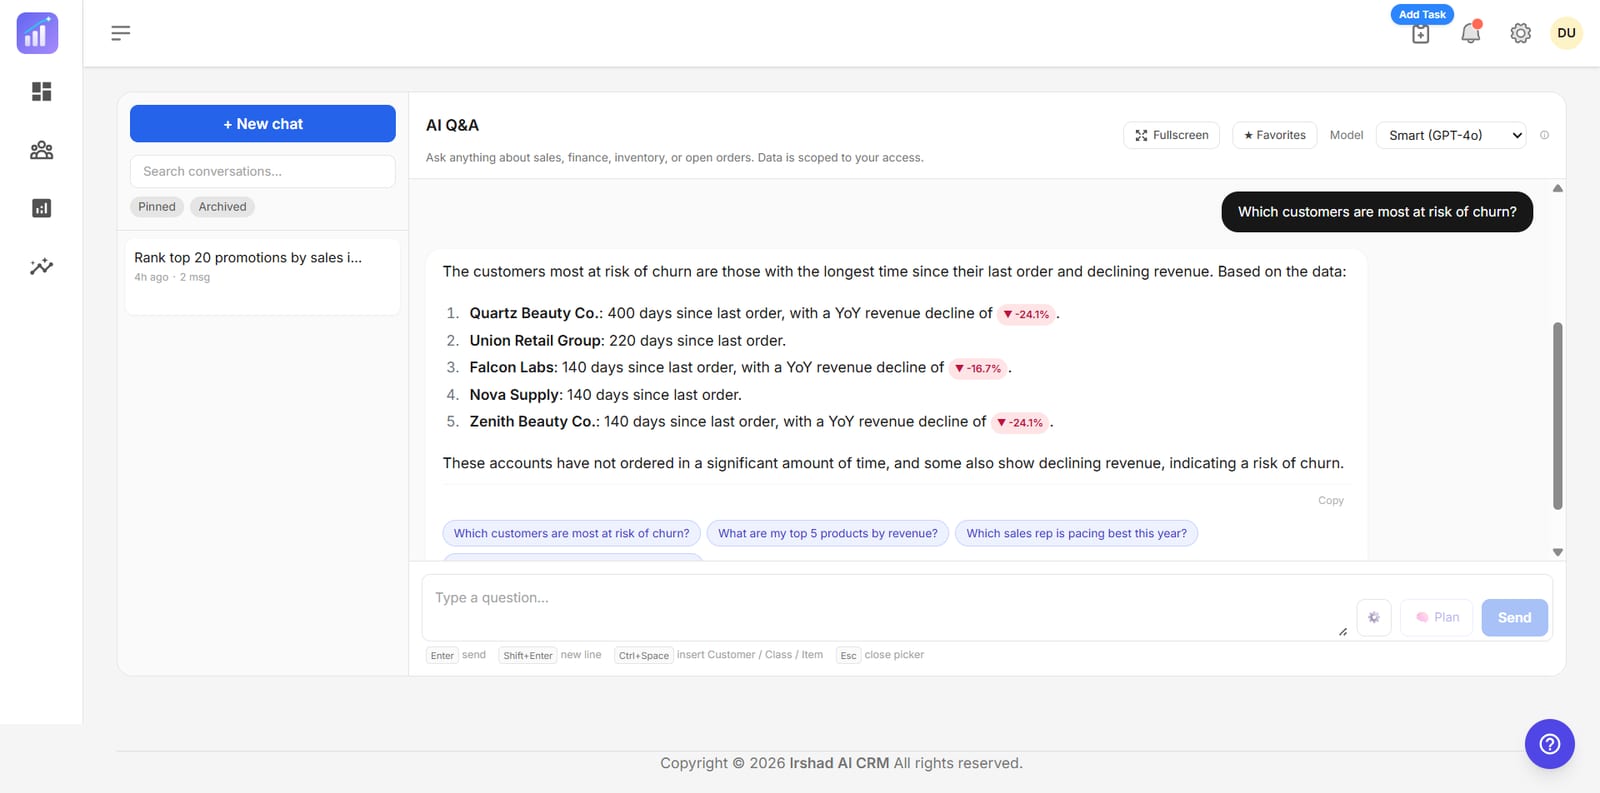
AI Q&A analyst that answers questions about sales, customers, products and suppliers in plain English, with charts.
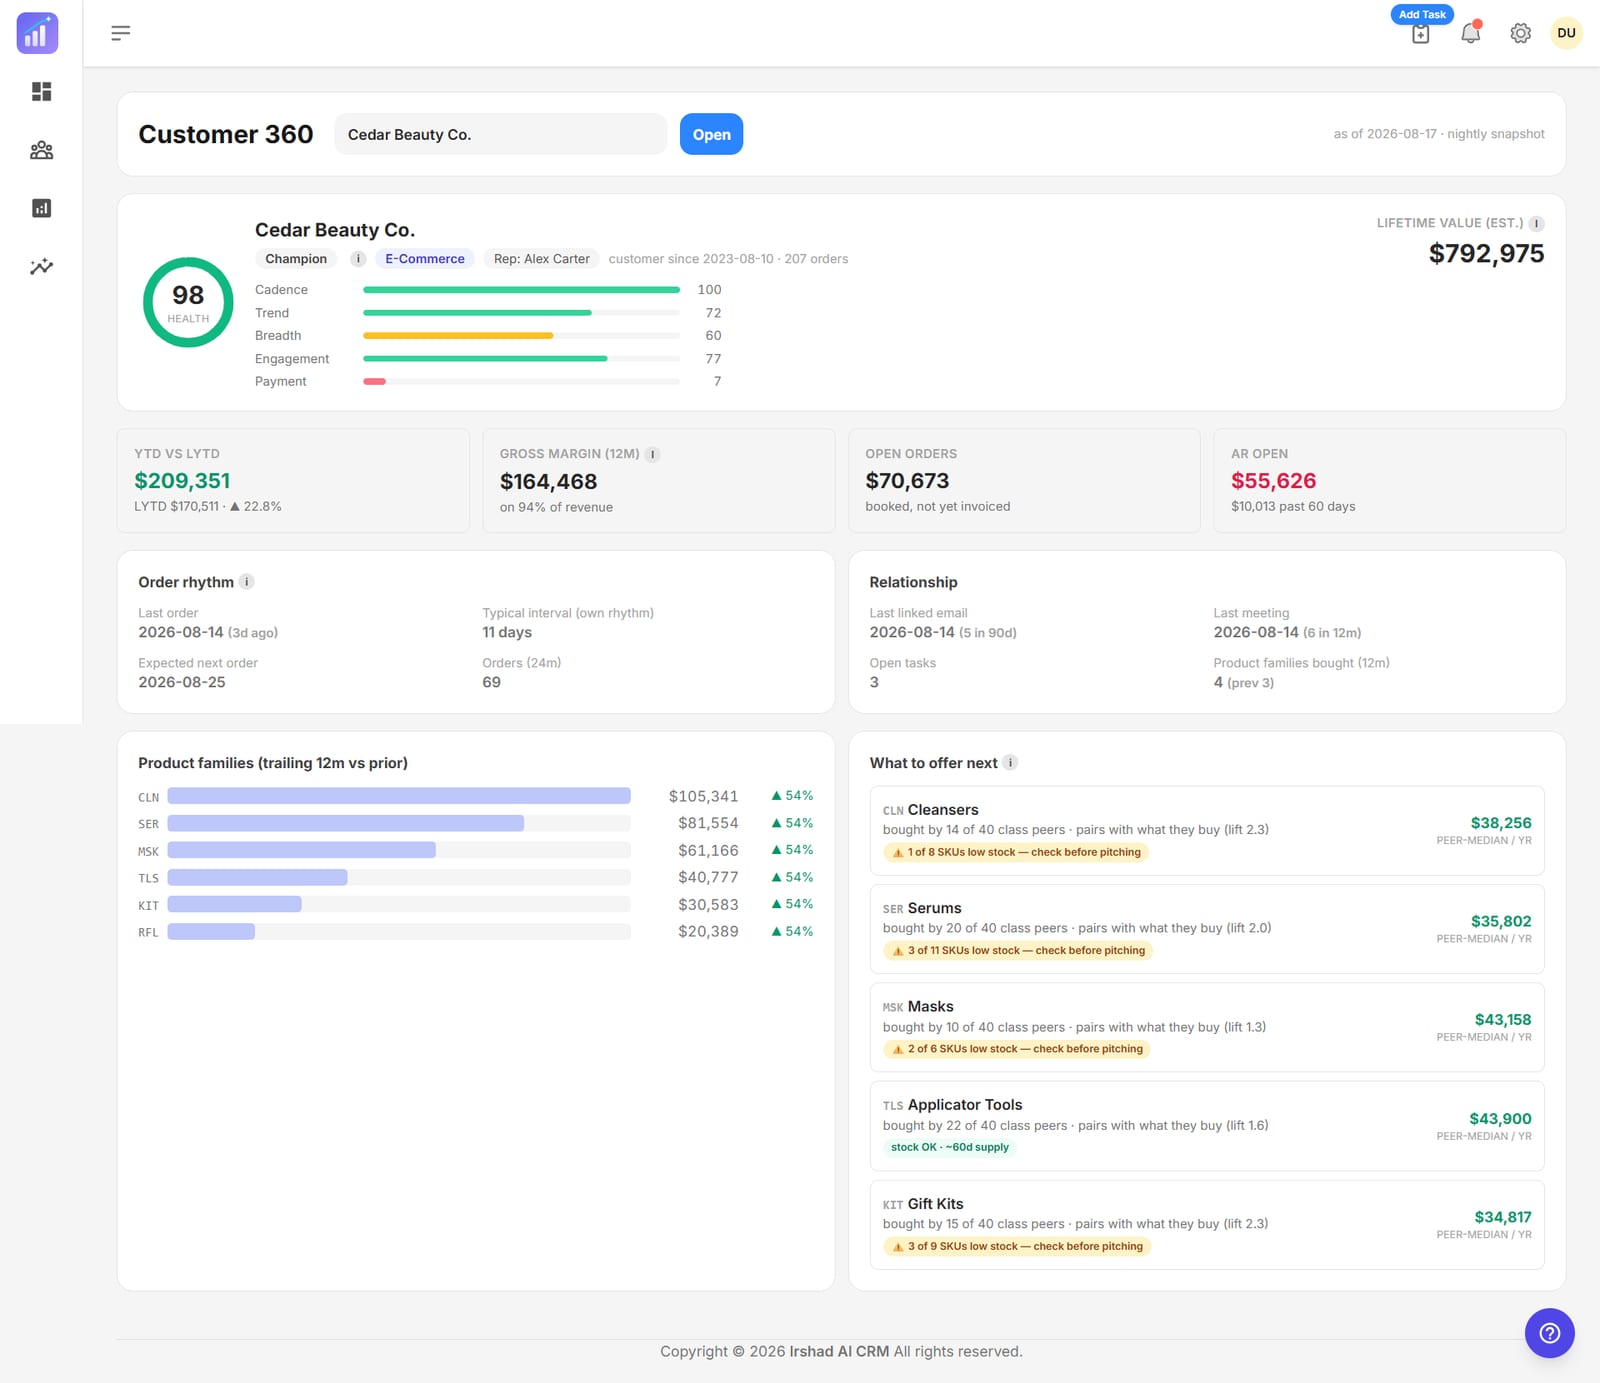
Customer 360 with health score, RFM, buying families and a next-best-offer for every account.
Product, Inventory and Supplier 360 covering price realization, stockout risk, excess and obsolete stock, and vendor concentration.
Runs on realistic sample data in this demo. Connect your own accounting and inventory software through a custom connector.
No sign-up required. The demo opens straight into the workspace.
Open the live demo Open the live demo
crm sales analytics ai dashboard demo
Executive Pulse dashboard showing shipped revenue year to date, sales target attainment, open order pipeline, gross margin, an AI CEO brief and revenue broken down by customer class.

Watch

Irshad AI CRM — a sales CRM with a built-in AI analyst

The Executive Pulse board, plain-English AI Q&A with charts computed from your own data, Customer 360 with health scores and next-best offers, and Inventory and Supplier 360s — connected to your accounting and inventory software through a custom connector. Try the live demo, no sign-up needed.

Irshad AI CRM is a demonstration of a full sales-operations CRM with an AI analyst built in. Explore the dashboards and ask the AI questions about the sample data.

To run it on your own data, request a custom connector for your accounting system (for example QuickBooks) and your inventory system (for example Fishbowl) and we will wire it up.
Screen Flow

Ordered from the earliest dashboard screen through reports, AI, and privacy settings.

2026-04-01 capture set

Executive Pulse dashboard showing shipped revenue year to date, sales target attainment, open order pipeline, gross margin, an AI CEO brief and revenue broken down by customer class.
One board-level view — revenue vs last year, pipeline, AR, margin and cash, with an AI brief that reads the numbers for you.
AI Q&A answering "Which customers declined the most vs last year?" with a table of accounts, year-on-year change, revenue and rep, plus suggested follow-up questions.
Ask in plain English. The analyst answers from your data and suggests the next question worth asking.
Customer 360 page for a single account with a health score, lifetime value, order rhythm, product families bought and next-best-offer recommendations.
Customer 360 — health score, buying rhythm and what to offer this account next.
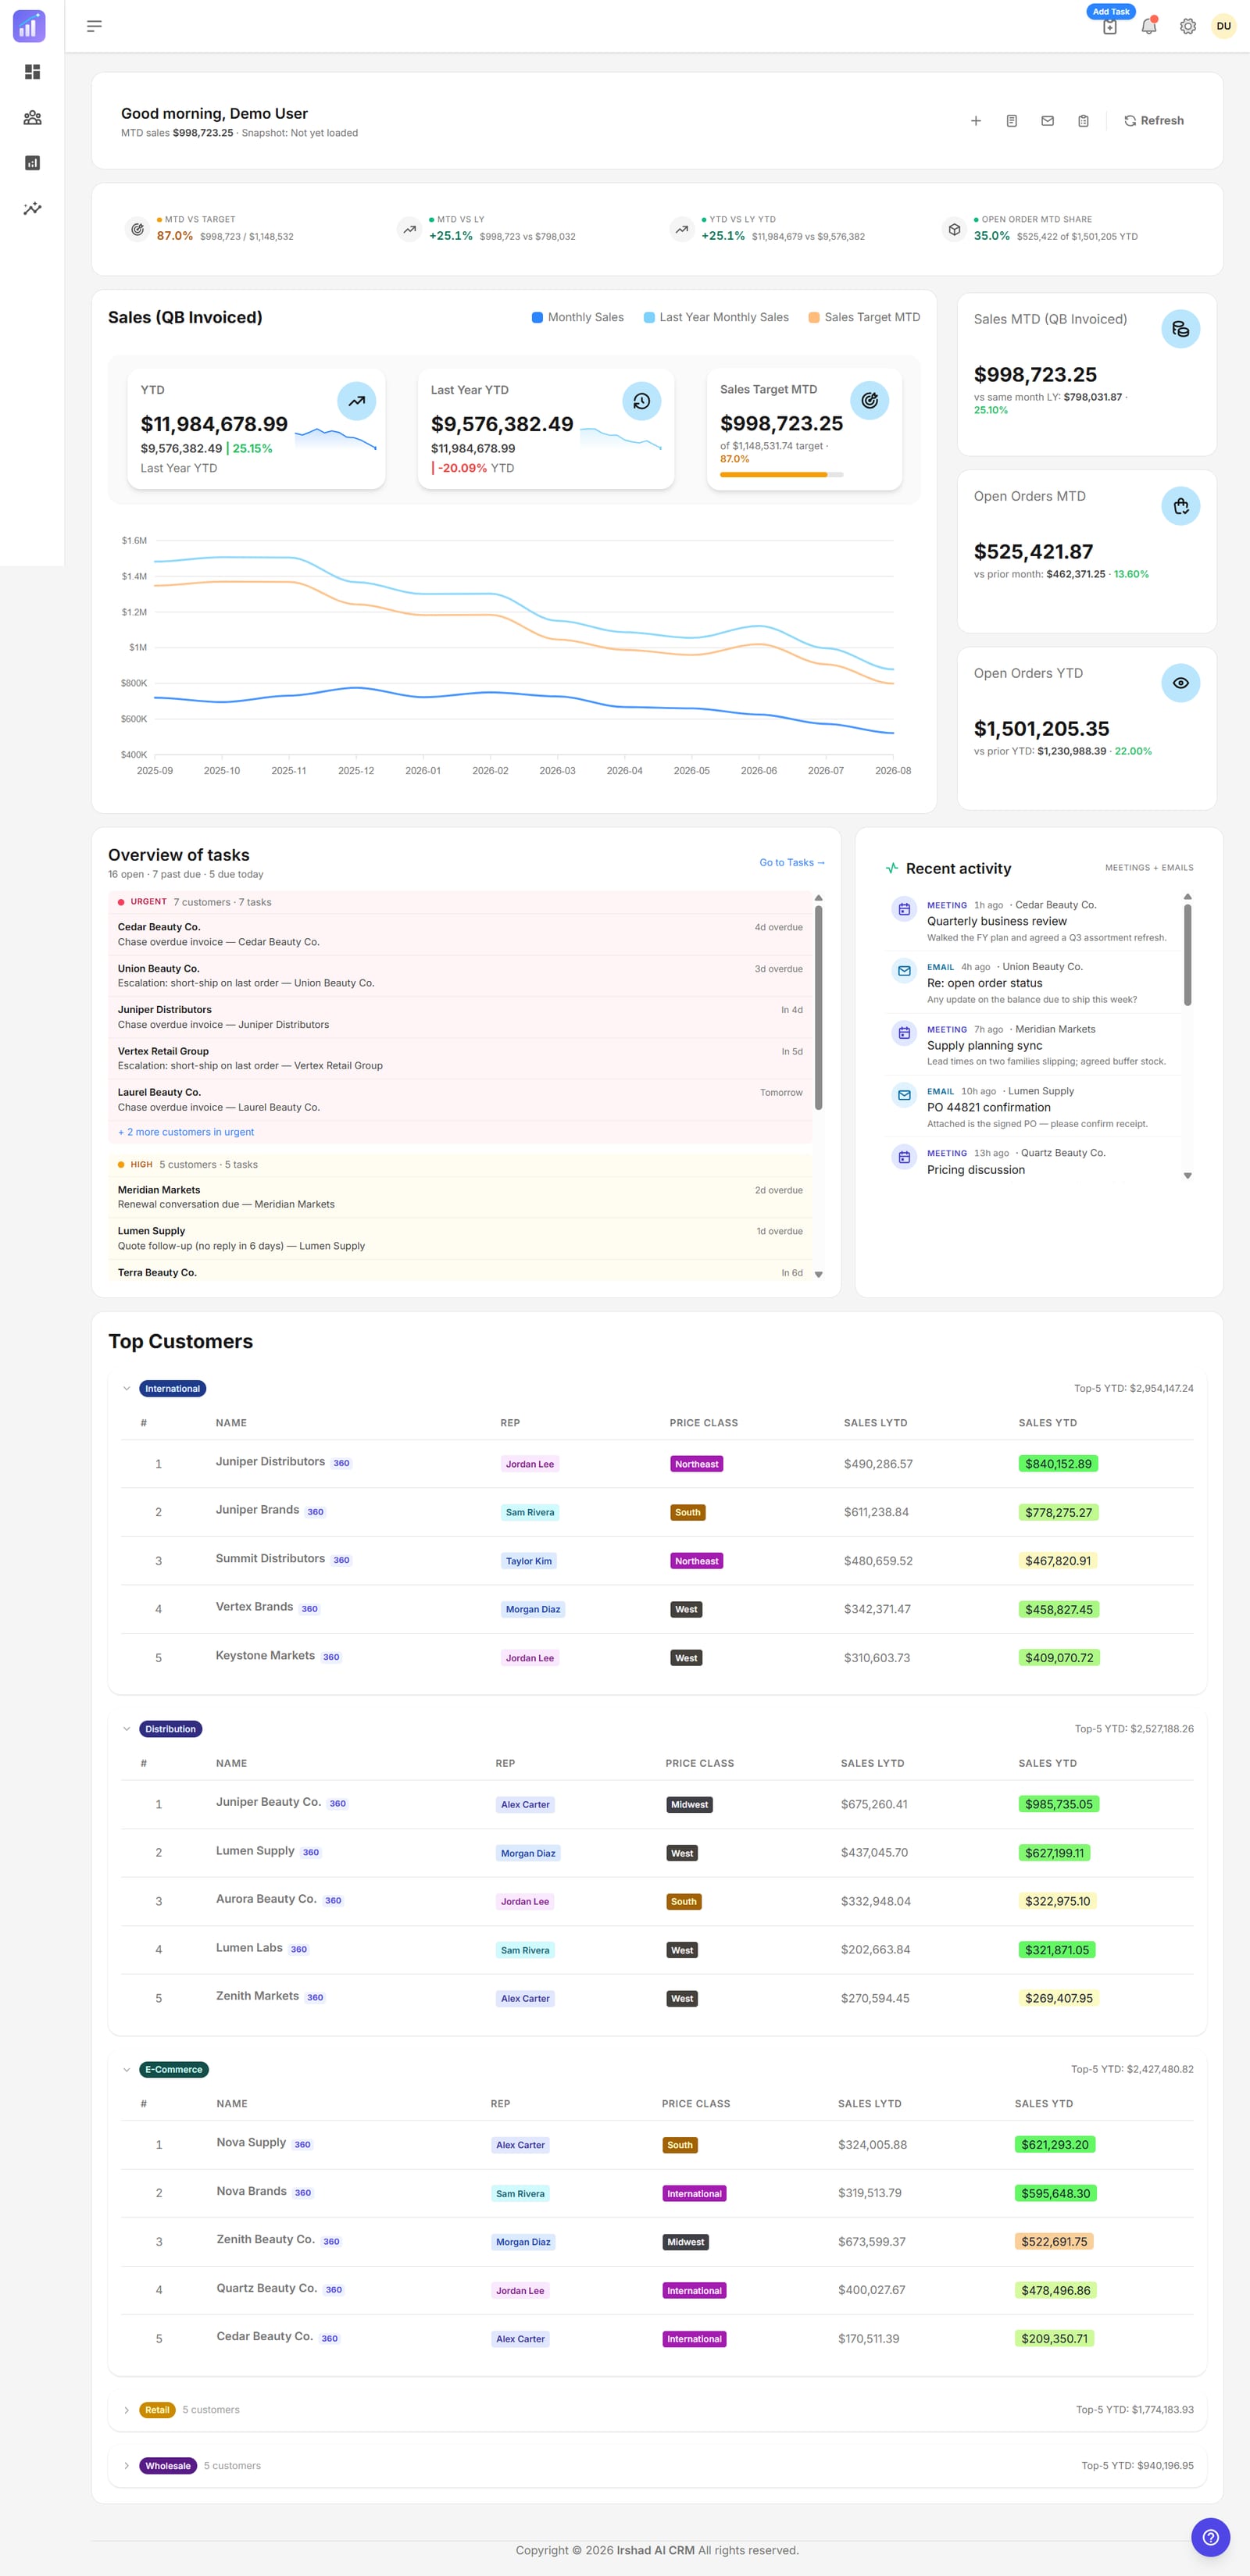
Main dashboard with month-to-date sales versus target, a twelve month sales chart, an open task queue grouped by urgency and top customers by class.
The daily view — how the month is tracking, what needs chasing, and who is buying.
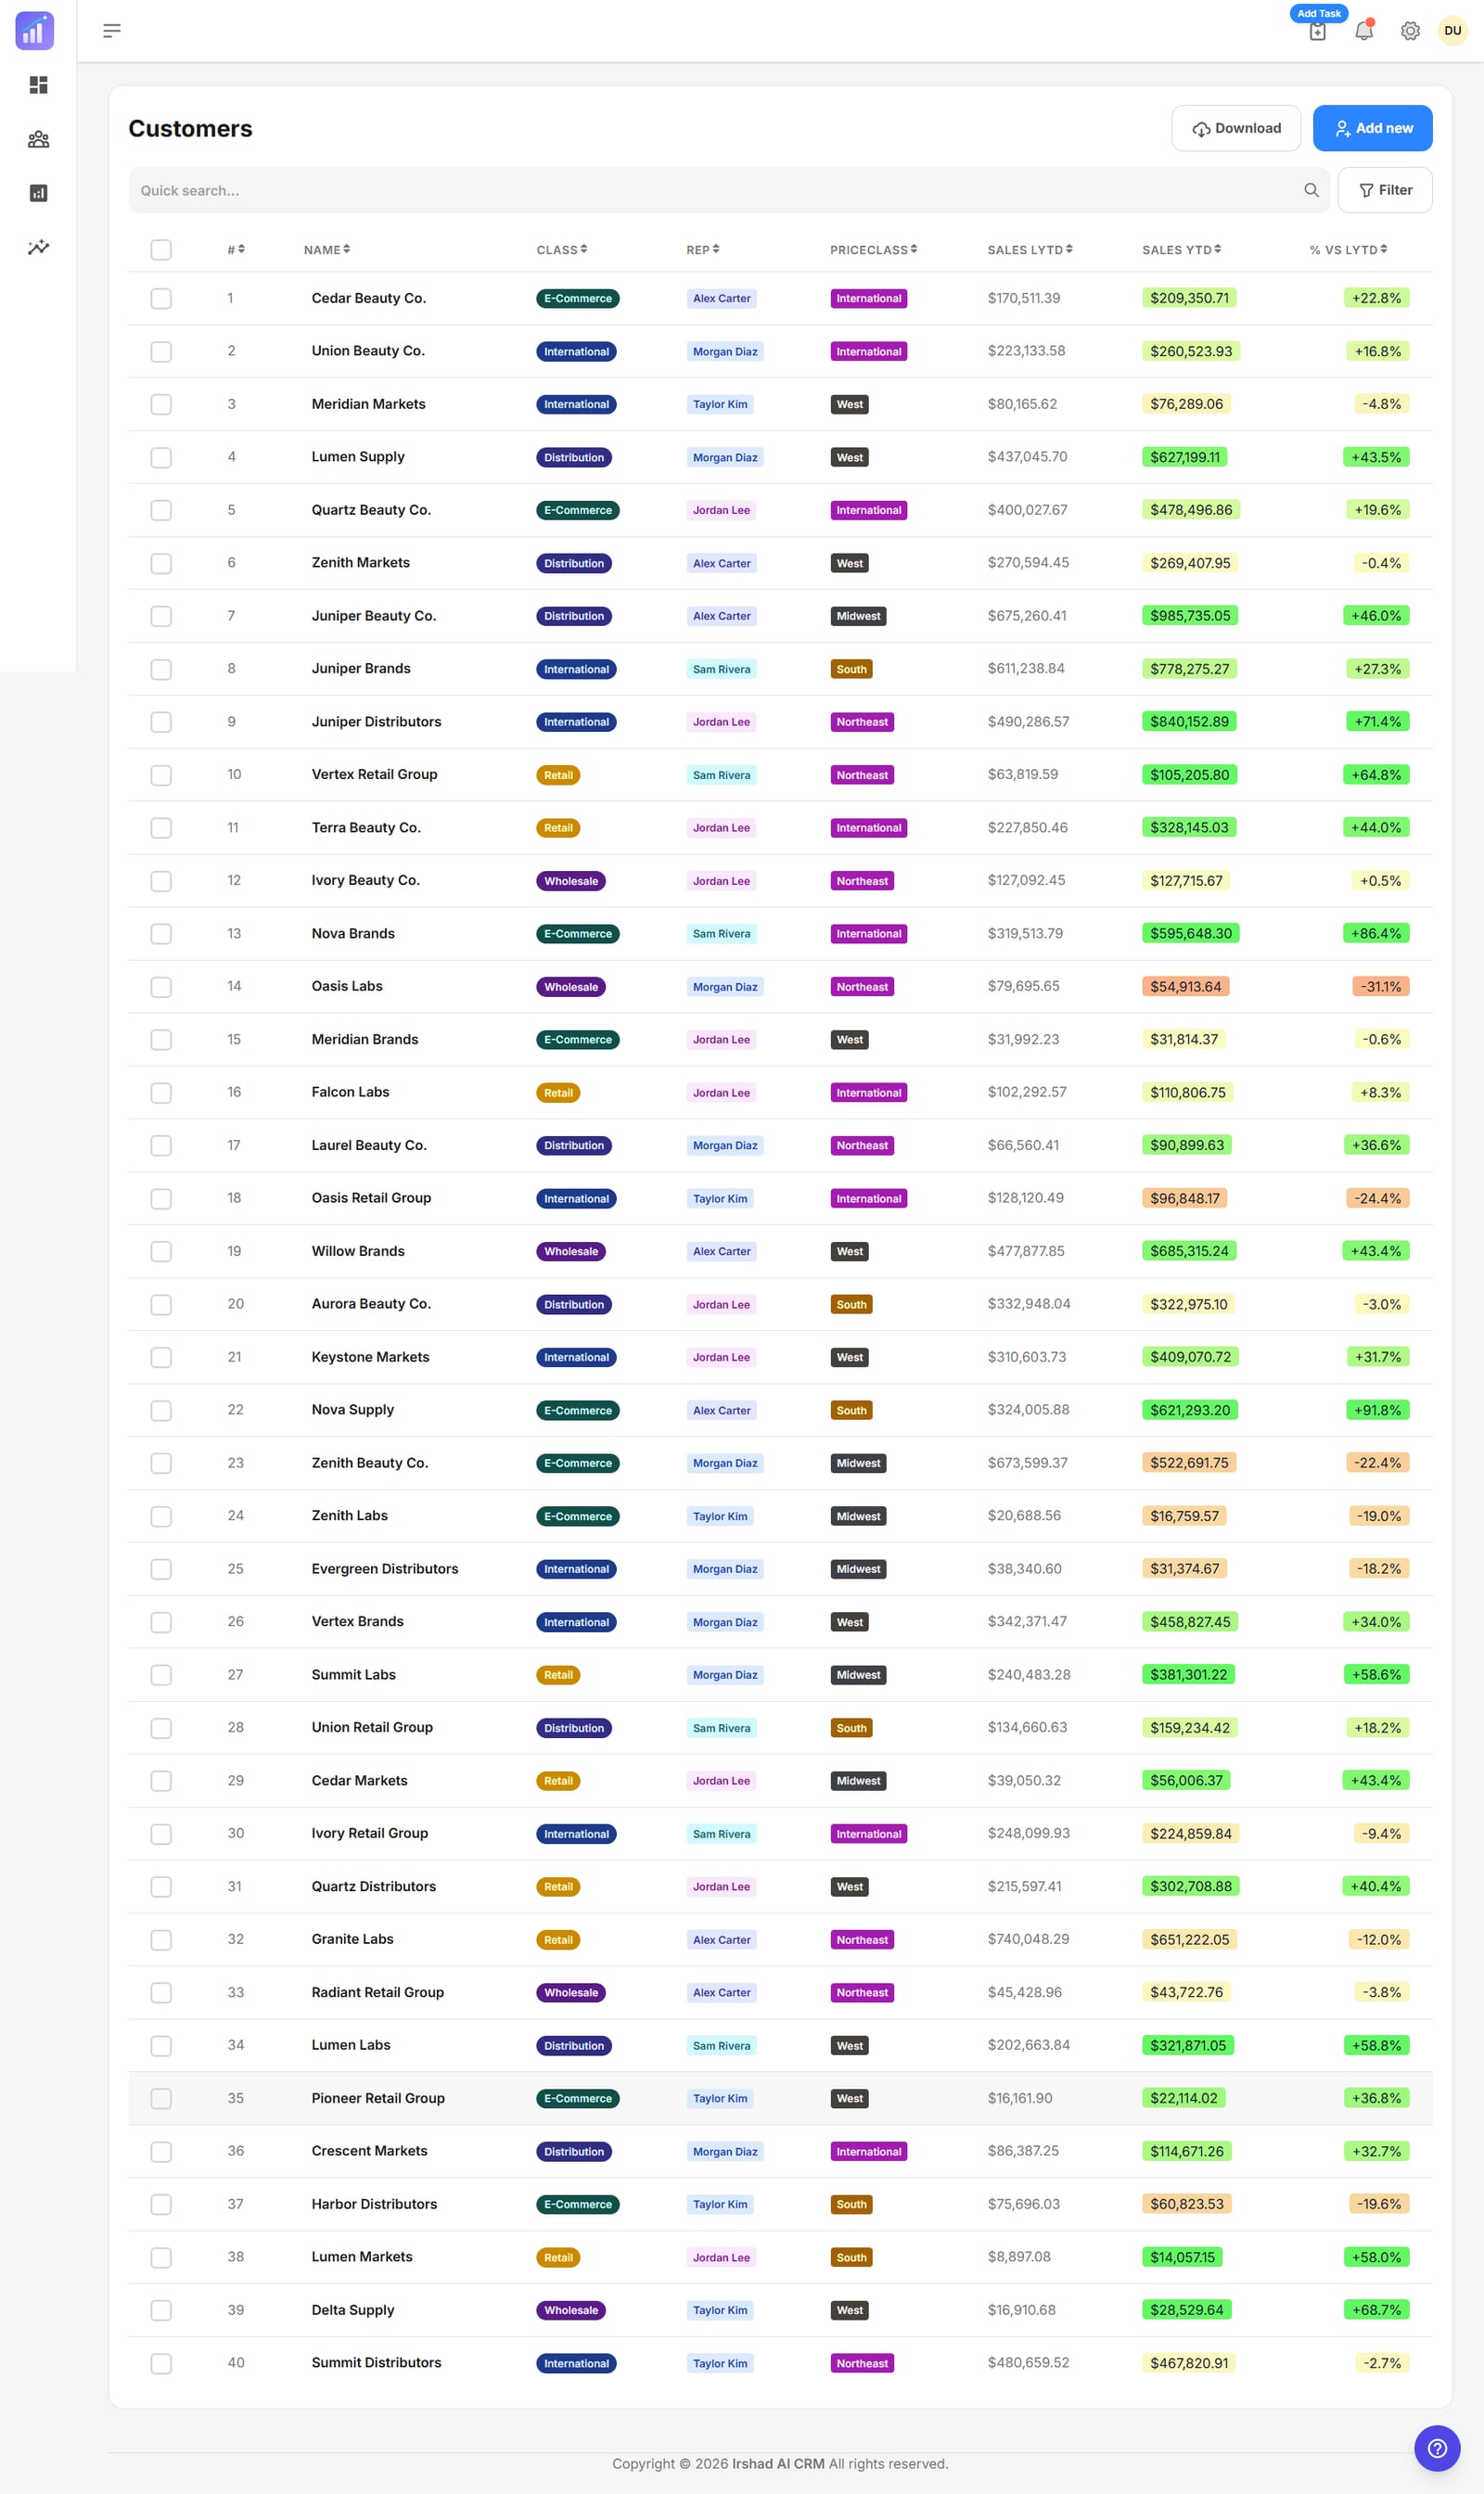
Searchable customer list with class, rep, price class and sales year to date versus last year, colour coded by growth.
Every account in one sortable list, with year-on-year movement colour-coded.
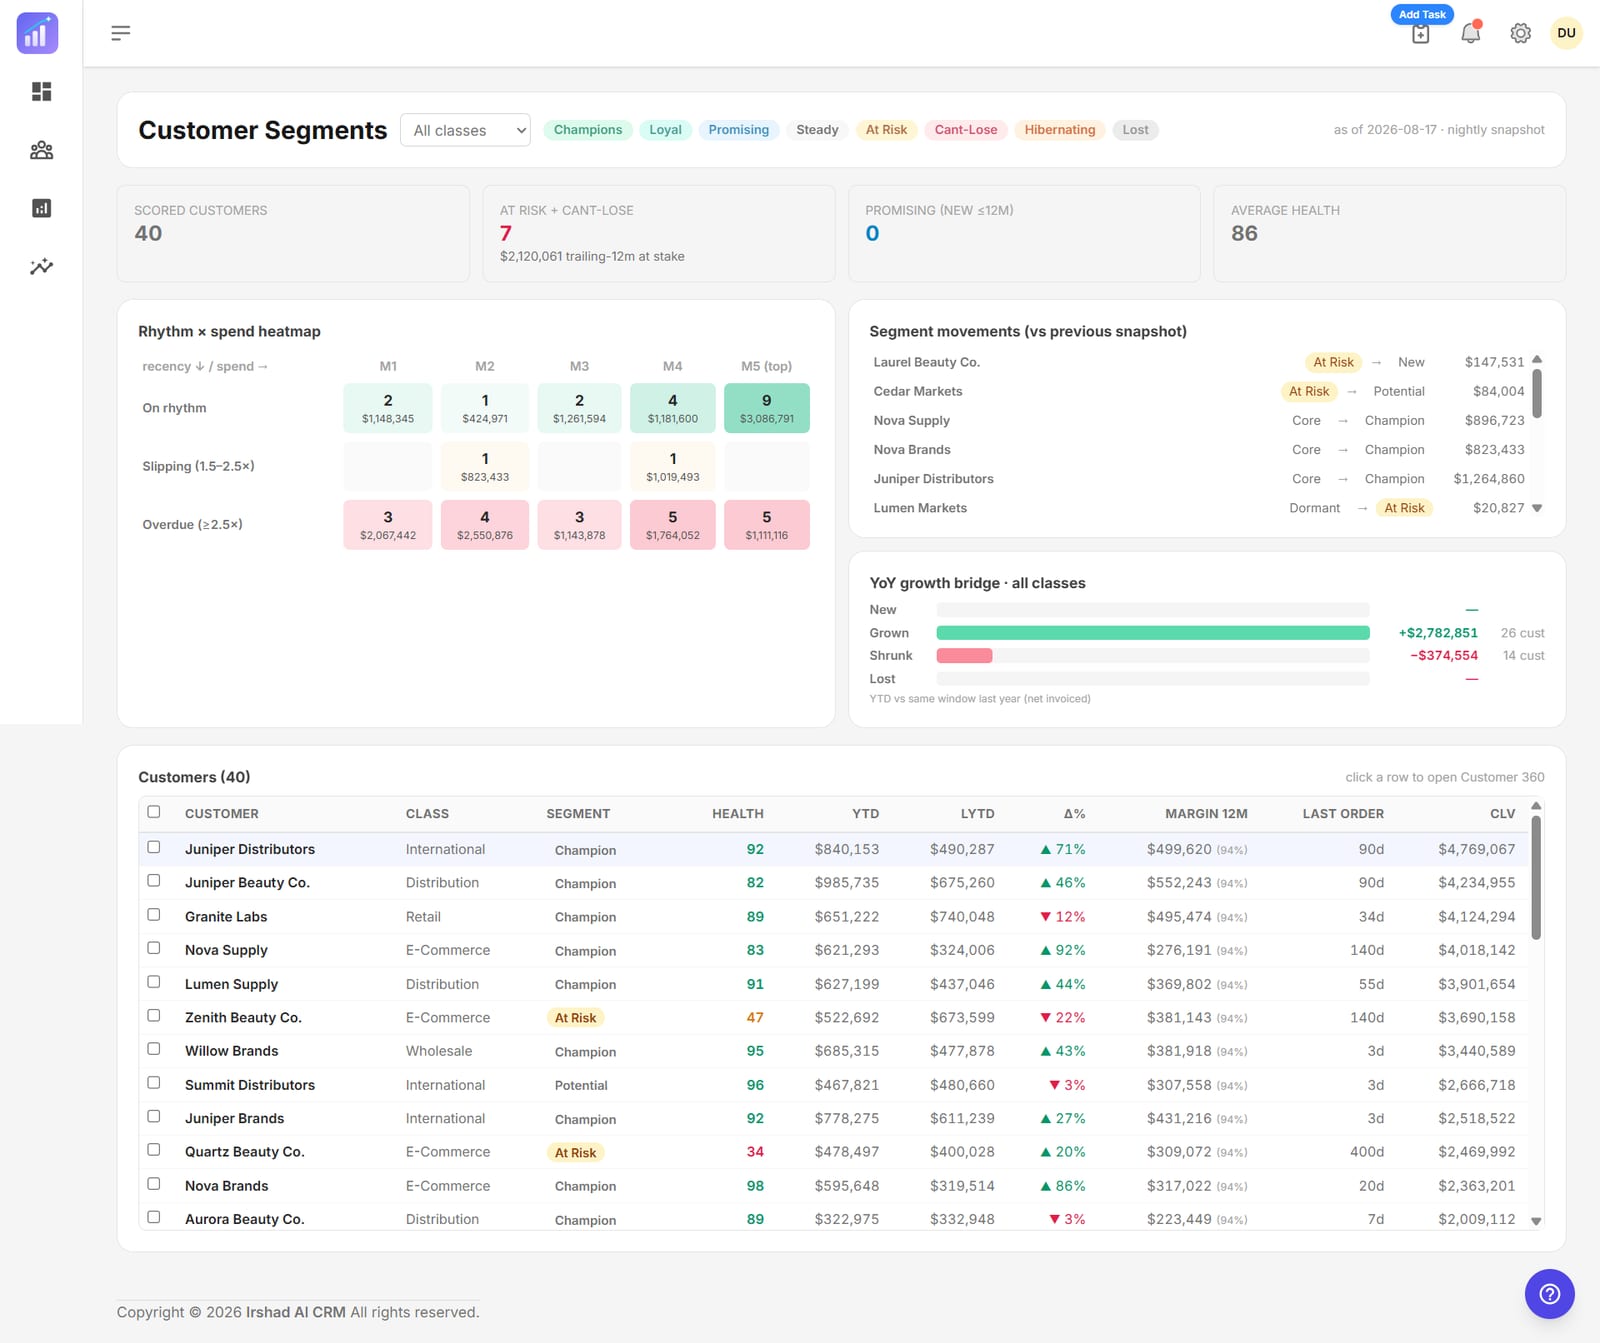
Customer segments explorer with a rhythm by spend heatmap, segment movements since the last snapshot and a year-on-year growth bridge.
Segment the book by buying rhythm and spend, and see who moved since the last snapshot.
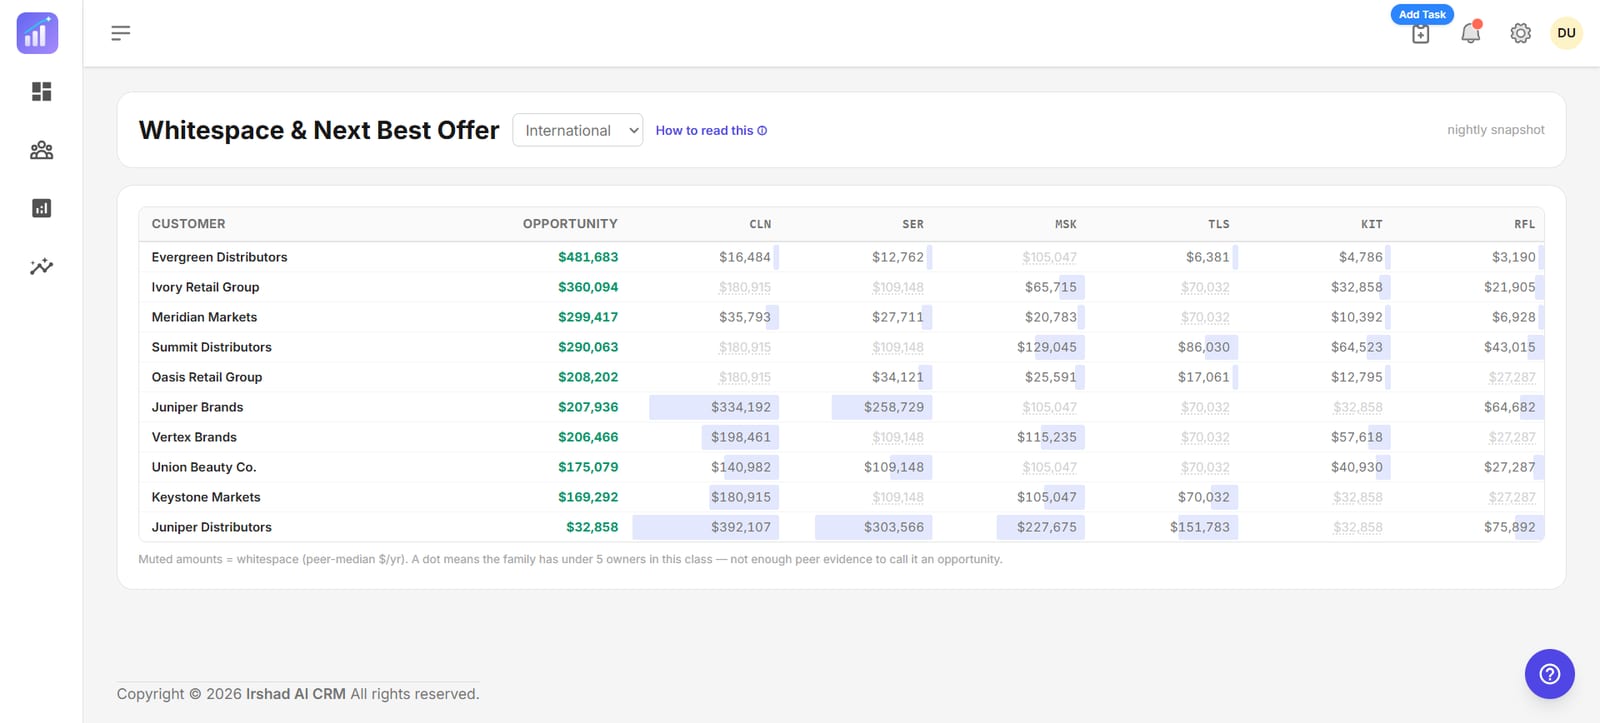
Whitespace matrix showing which product families each customer already buys and the peer-median opportunity for the ones they do not.
Whitespace — the product families each account is not buying yet, sized by what peers spend.
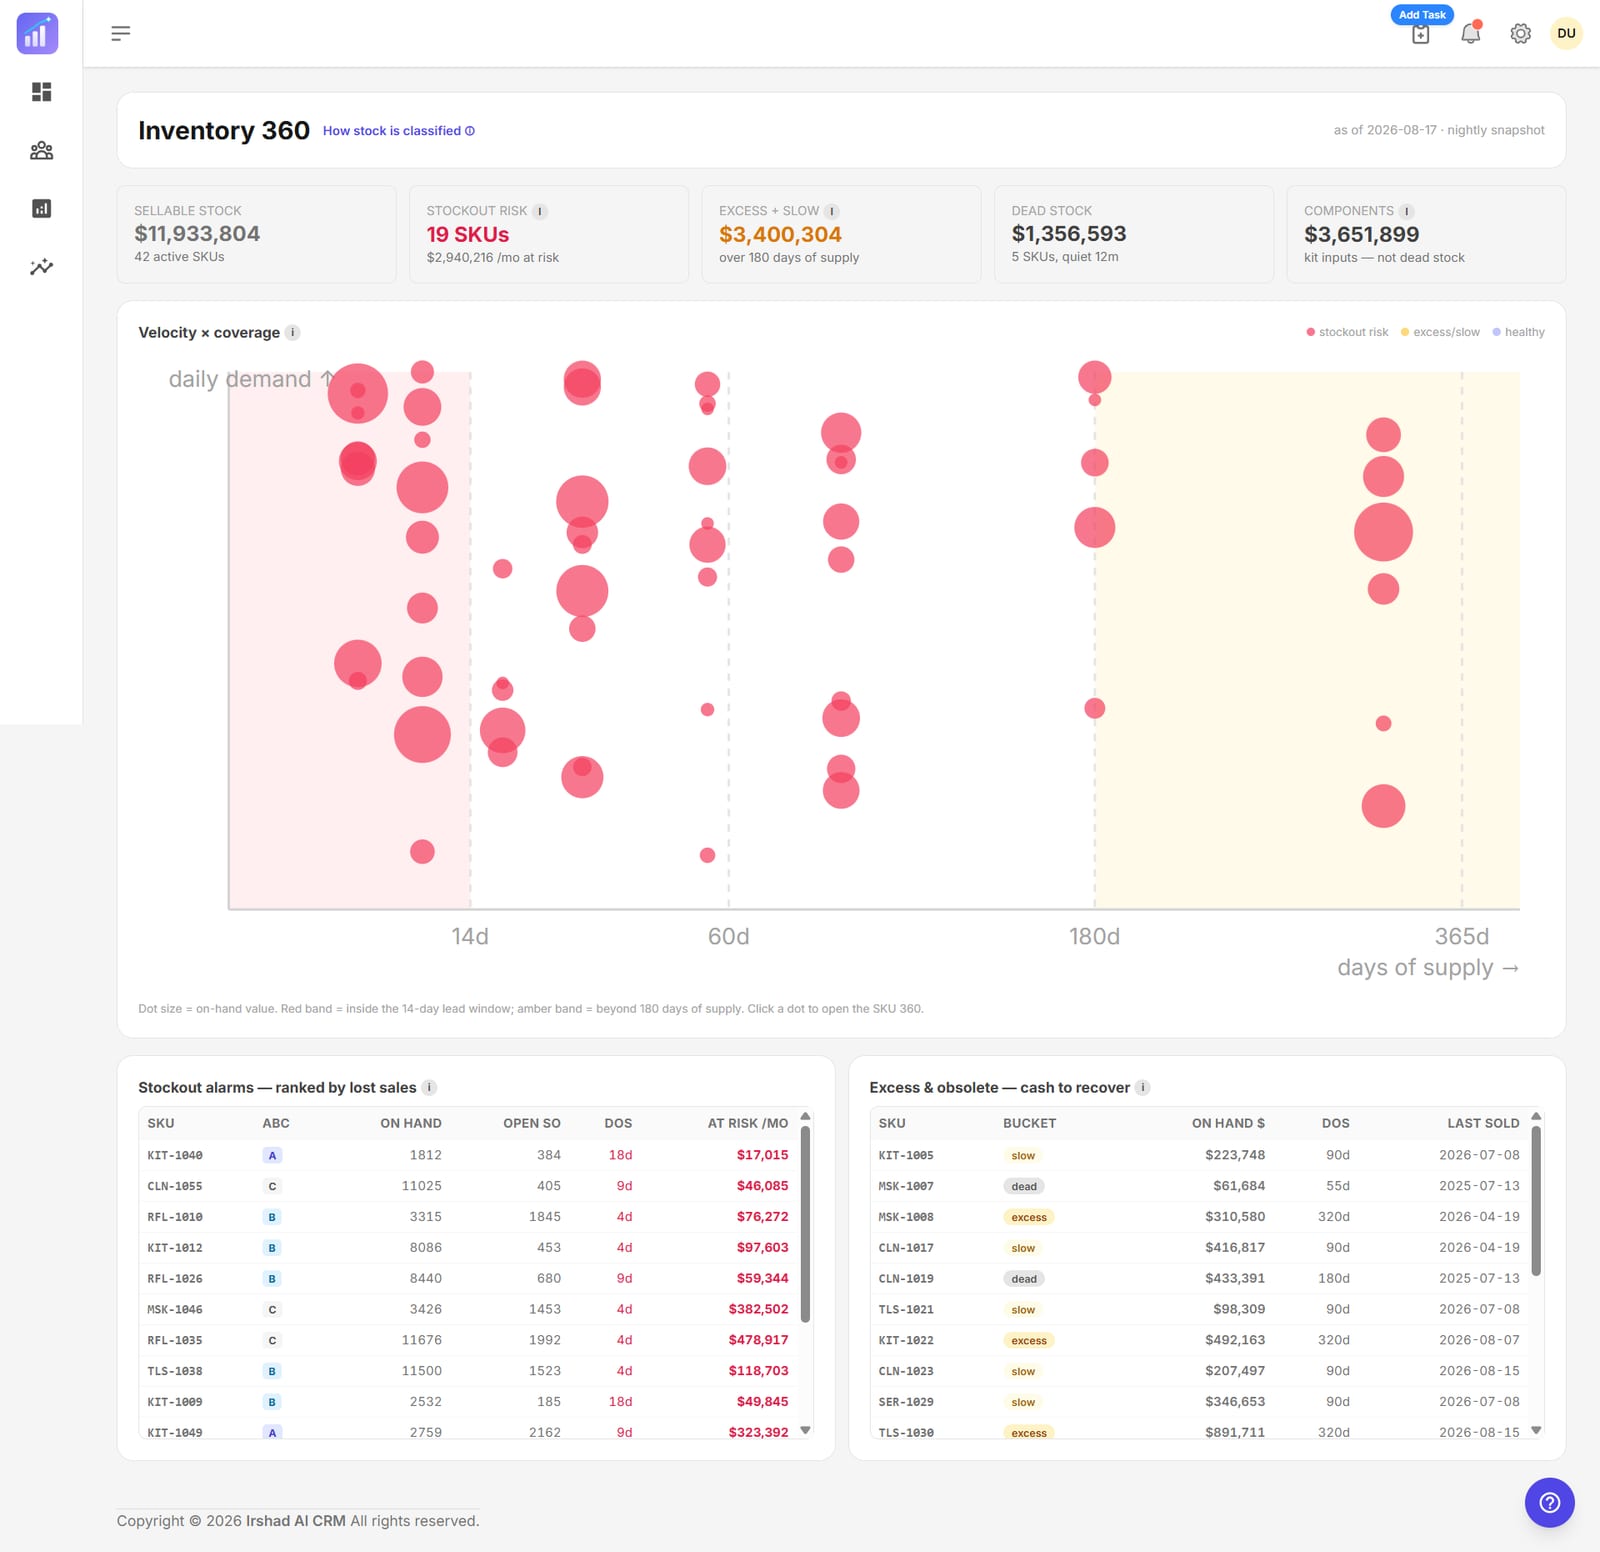
Inventory 360 with sellable stock value, stockout risk, excess and slow stock, a velocity by coverage bubble chart and ranked stockout alarms.
Inventory 360 — stockout risk ranked by lost sales, and the cash tied up in excess stock.
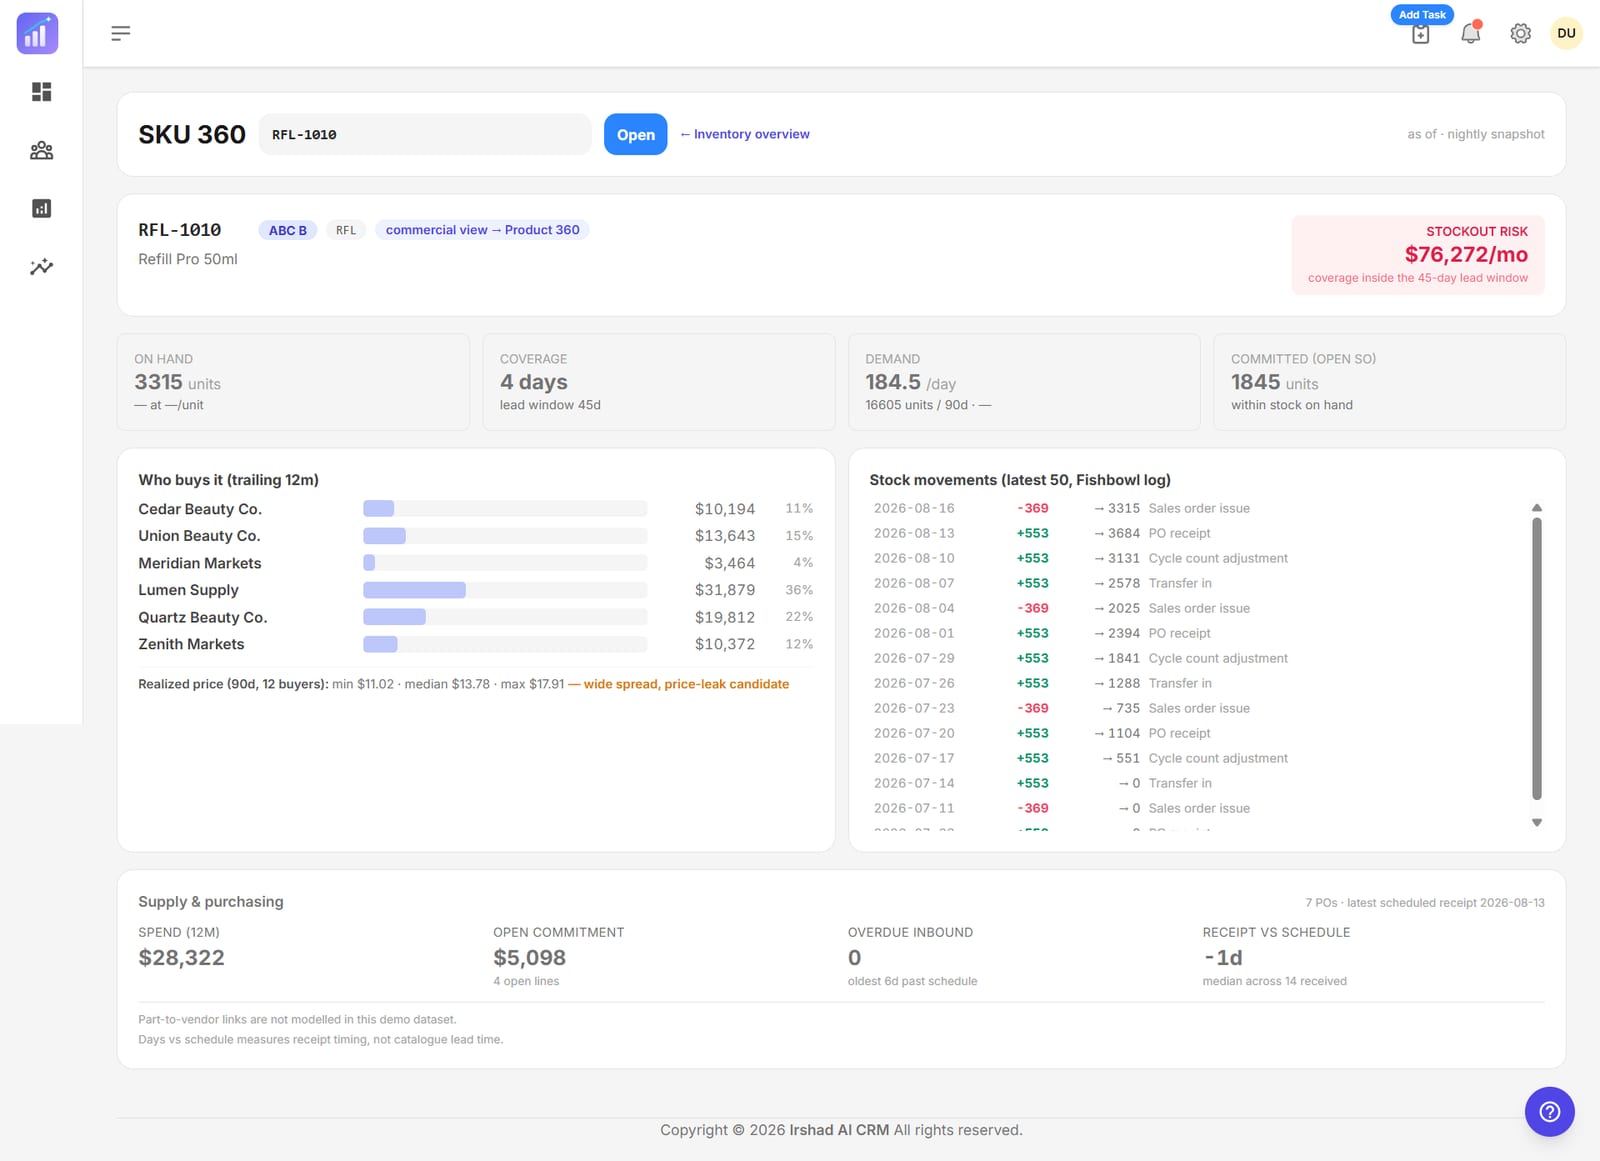
SKU 360 for a single part showing on-hand units, days of coverage, daily demand, committed open sales orders, who buys it, the realized price spread and a Fishbowl stock movement log.
Drill into one SKU — coverage against the lead window, who buys it, and every stock movement behind the number.
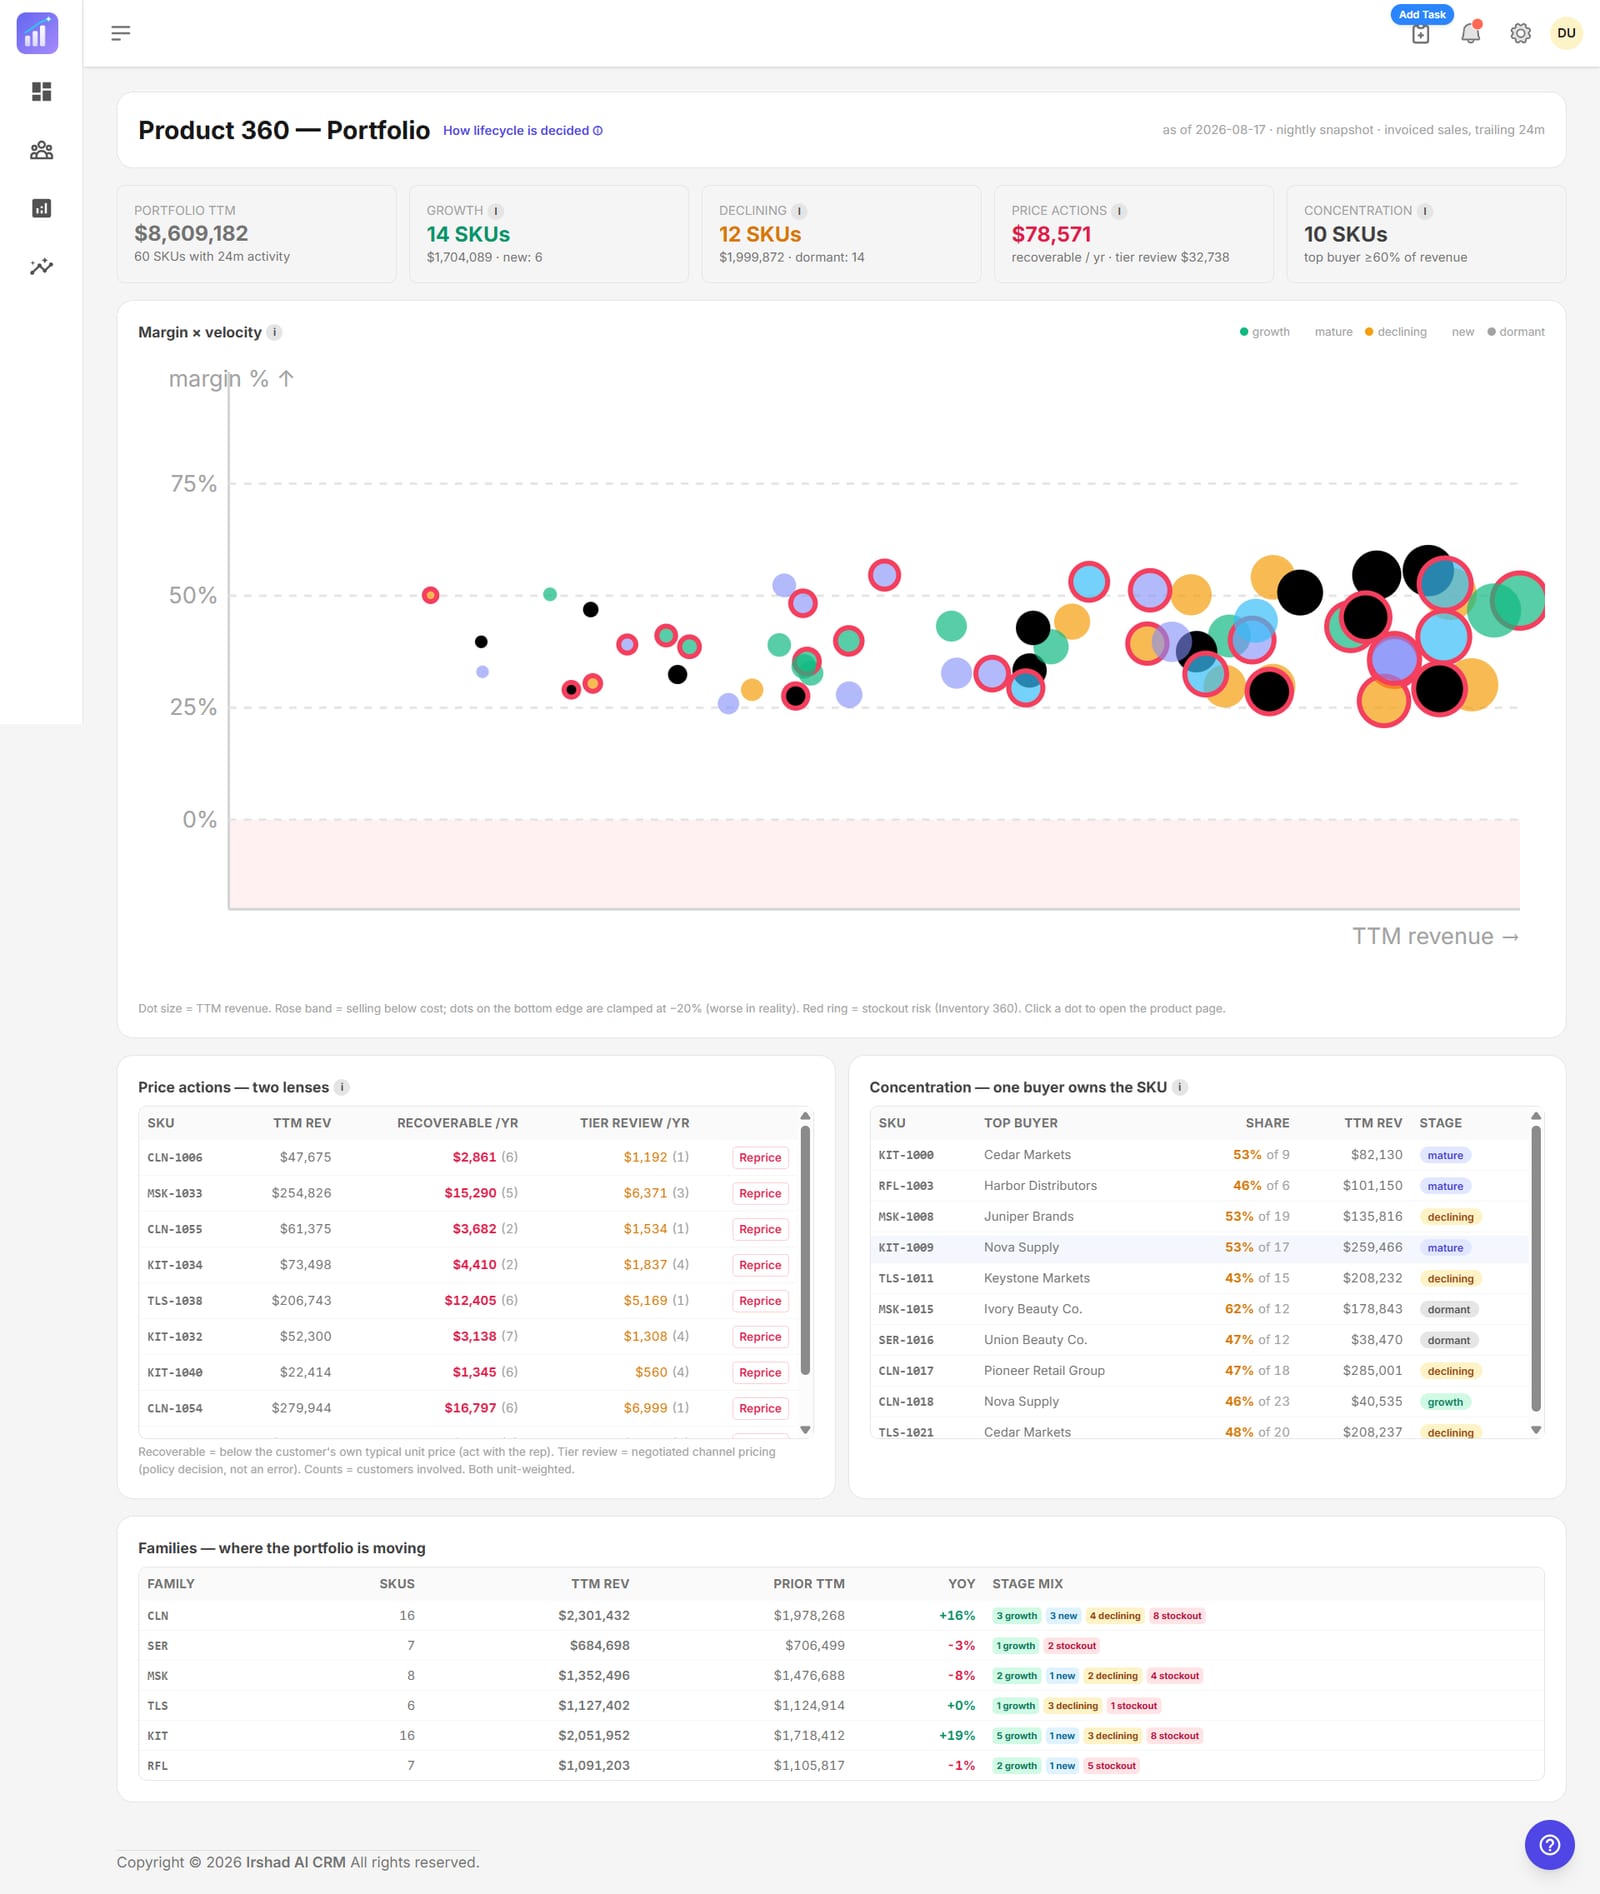
Product 360 portfolio with a margin by velocity scatter chart, price action opportunities, SKU concentration by buyer and family level performance.
Product 360 — margin against velocity for every SKU, with the price leaks worth acting on.
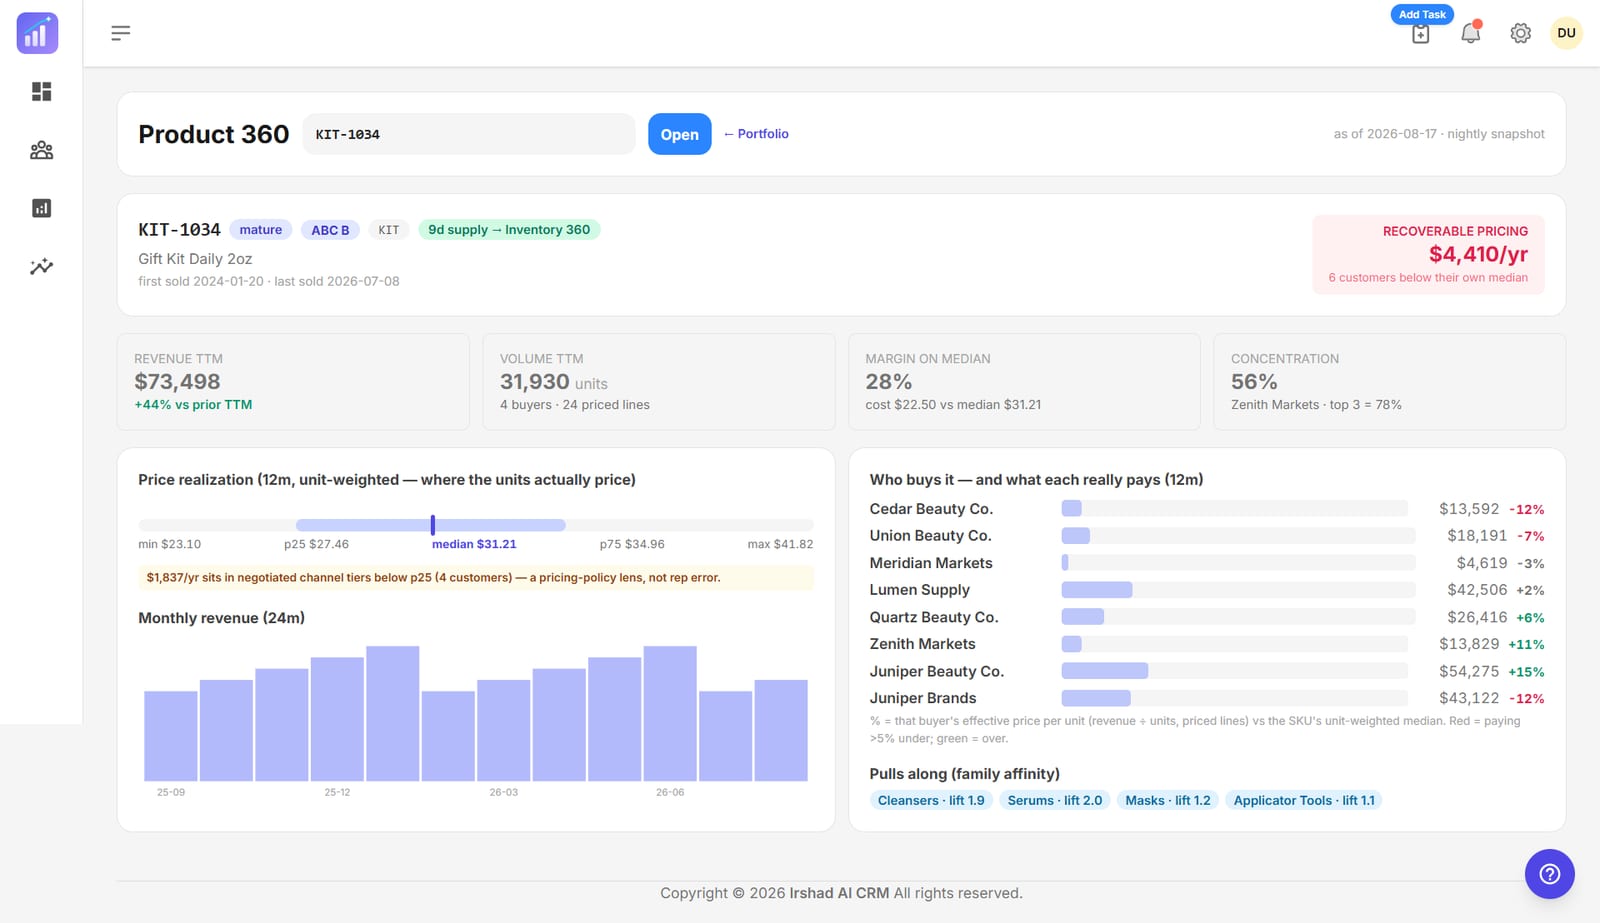
Product detail page with revenue and volume trailing twelve months, margin on median price, buyer concentration, price realization band and monthly revenue bars.
Per-product economics — what each buyer actually pays versus the median.
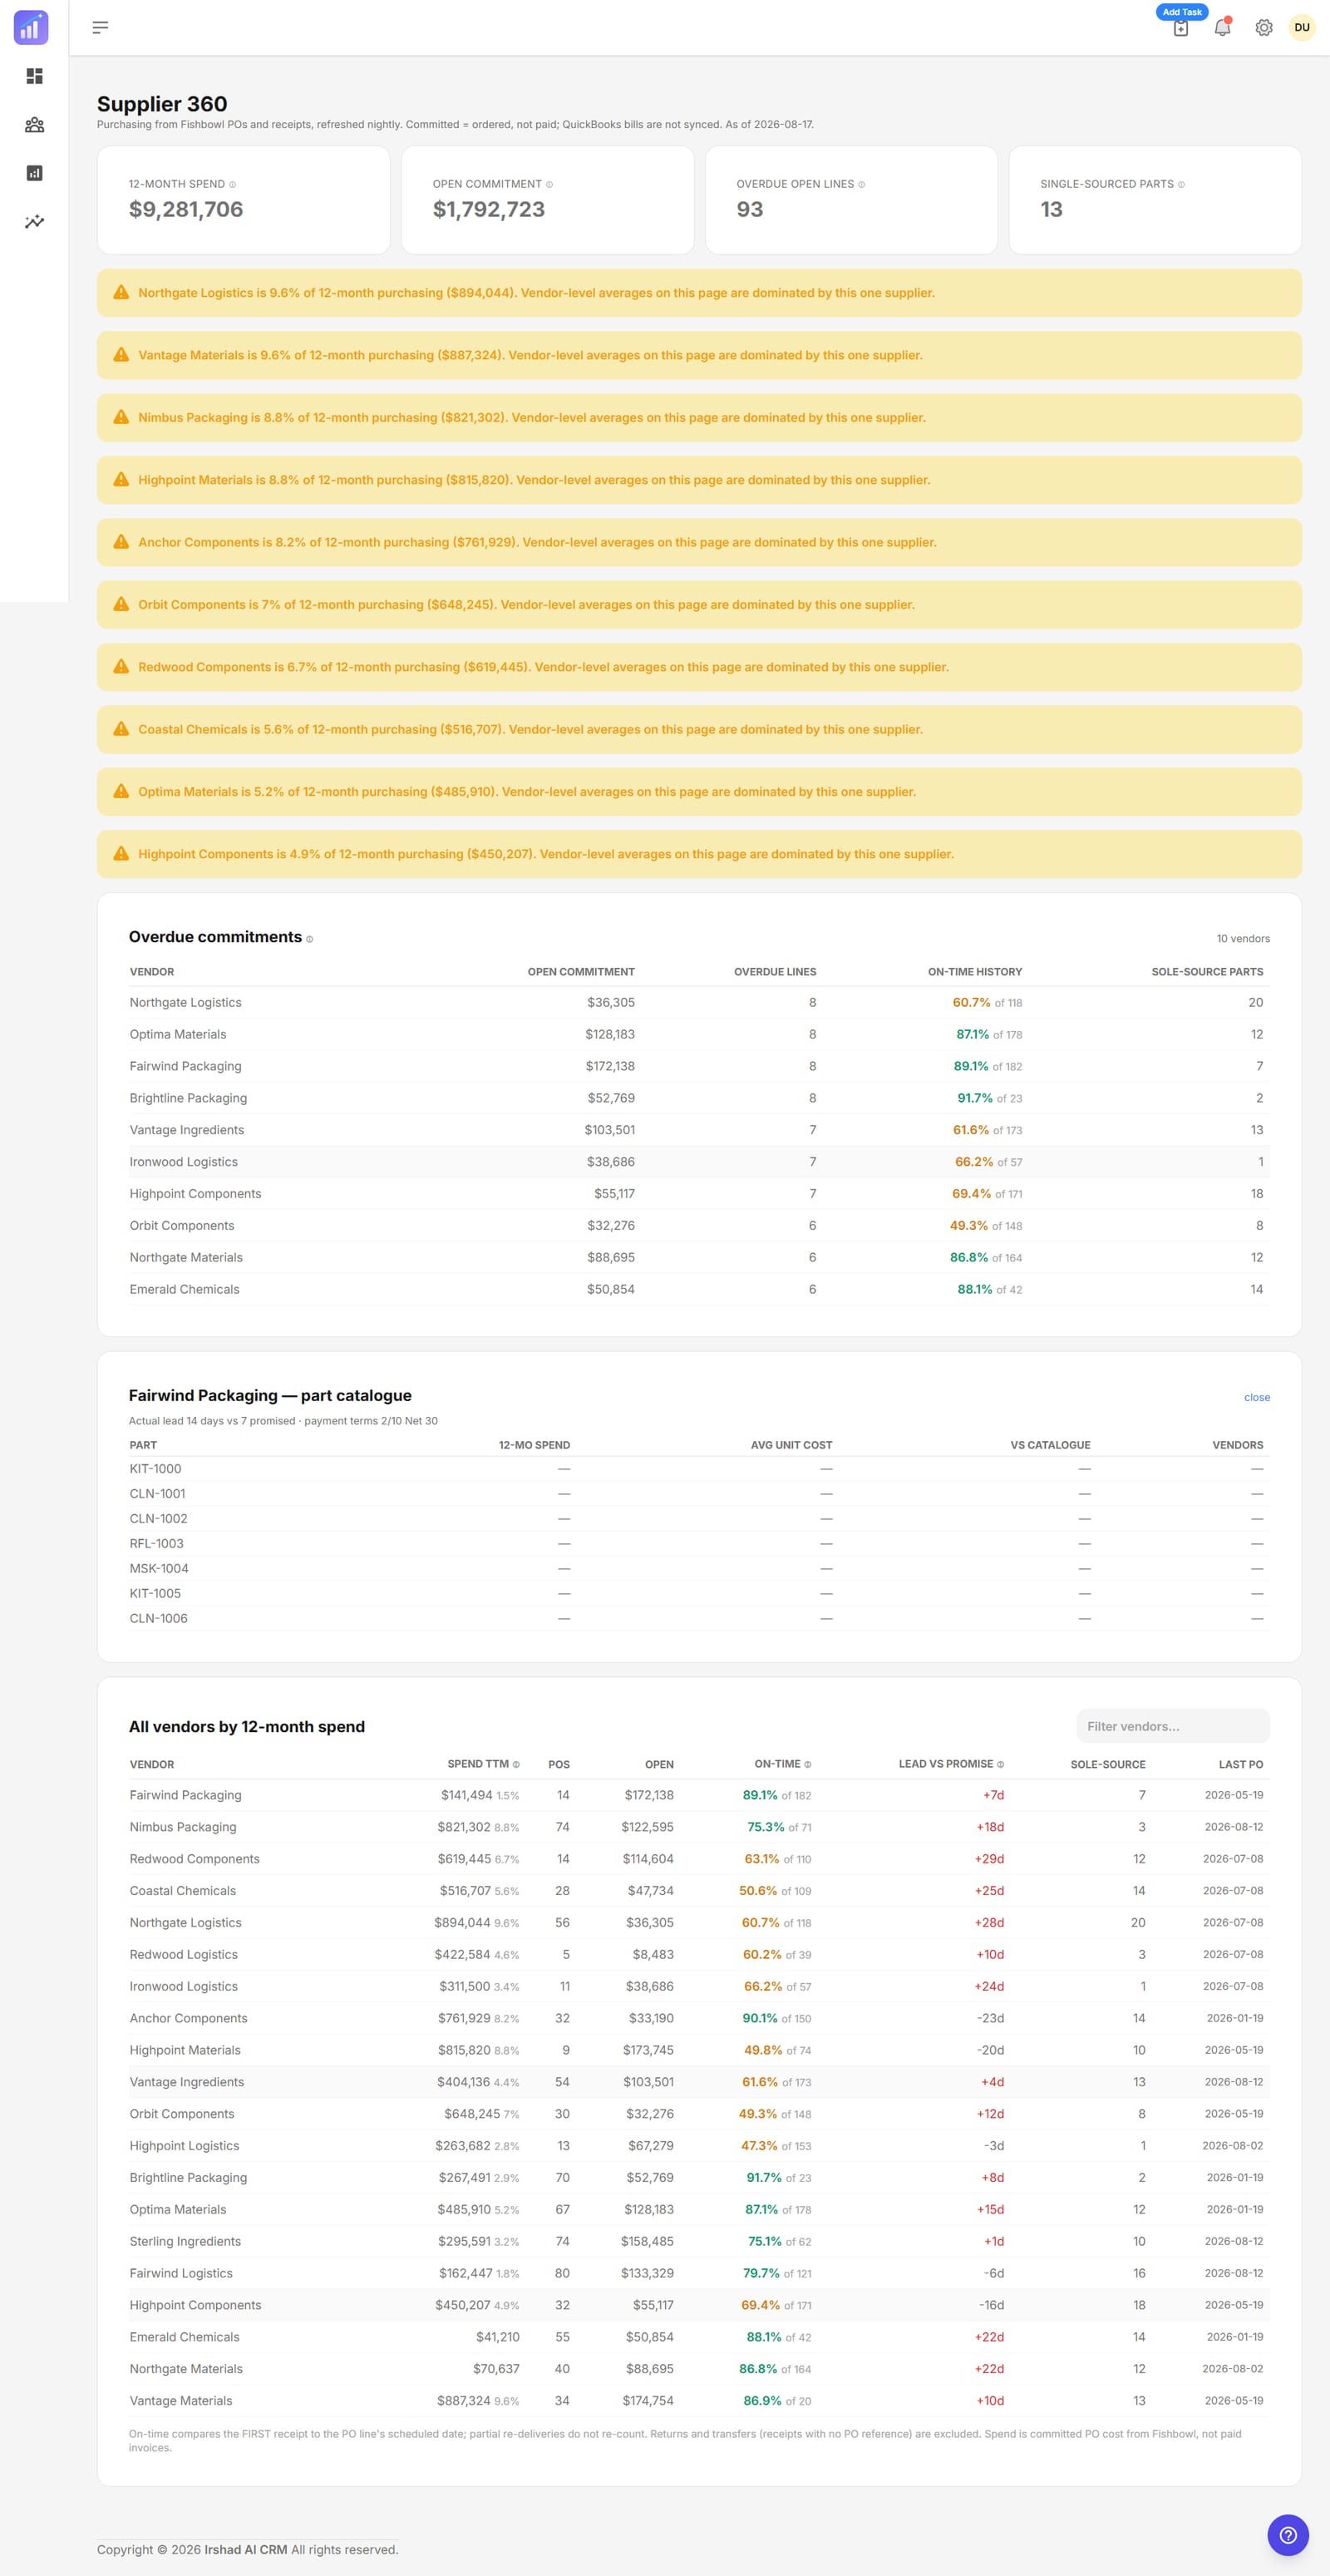
Supplier 360 with twelve month spend, open commitment, overdue lines, vendor concentration warnings and a ranked overdue commitments table.
Supplier 360 — where purchasing is concentrated and which vendors are running late.
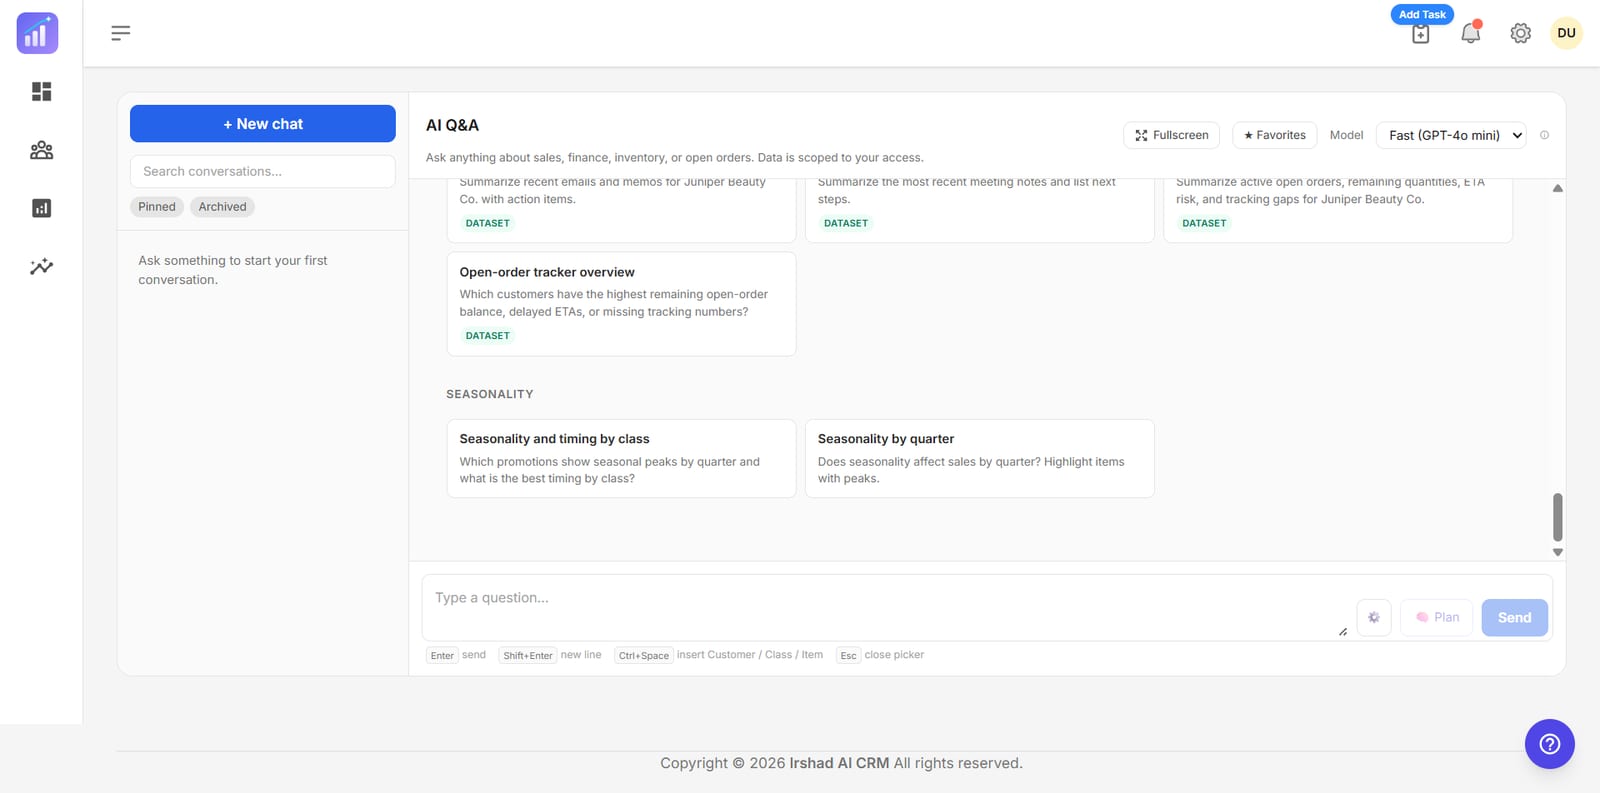
AI Q&A empty state offering starter questions grouped by company pulse, finance and cash, diagnostics and monthly trends.
Starter questions get you to an answer without learning a query language.

Want something like this built?

This product is not a case study written after the fact — it is running, and the same hands built it. If you need AI that answers from your own documents and cites what it used, that is the AI integration and RAG service. For the application around it, see web application development, or take over something that already exists.

Send a project brief →
AI Q&A